


A True Sea Change in
Fuel Management Software ...
Real Time data with no timed or manual polling required.
Real Time Stock Figures Updated with each transaction
Easy to Understand - simple to operate
Integrated User Guide embedded in each web page
Quickview Page gives a simple, real time overview of the entire network
Unique “Vision” Tiles give real time analysis of your entire fuelling operation
Full Suite of reports may be configured and generated automatically
Auto E-Mail of Reports
It Couldn’t be Easier ...
The Jigsaw Fuel web service has been designed to give easy access to all your fuelling data. The service splits the functions of your system in to the basic components - Sites, Vehicles and People so that navigating around the few screens required is straightforward and intuitive.
It doesn’t matter whether your network has just one fuelling site or a hundred, the system is just as easy to use. Even the reports are pre-configured requiring just the bare minimum of parameter setting before running.
Jigsaw Designers have spent many hours discussing, tweeking and perfecting the site so that every feature is just where it should be, every label is clear, and every page is uncluttered and simple to understand.


Features Checklist :

Fuelling Web
Service
No Feature is more than Two Mouse Clicks Away ...
One of the driving features of the web interface has been to make none of the major system functions more than two mouse clicks away; to add a new vehicle, select the “Vehicles” tab and then click “New” - that’s it - you can now add all the required details. To see all the fuellings sorted by a particular driver, select the “People” tab, select the user and there they are.
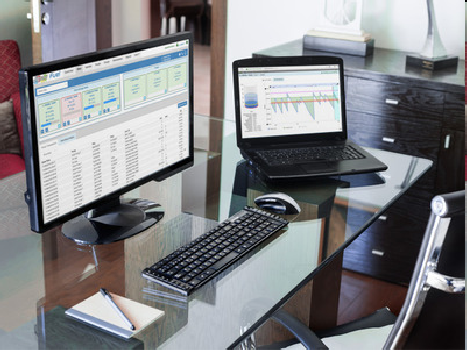
The Jigsaw Fuel web software is clean bright and colourful and a pleasure to use. Each page has a built in Page Guide which takes you through that pages features step by step. Because the software is hosted centrally, you have no worries about hardware compatibility, software updates or backups. Data may be accessed through PC’s, Macs, tablets or smart phones as the website is fully reactive to the format of each of these devices.
A pleasure to use ...
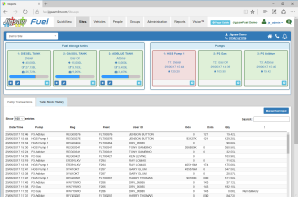
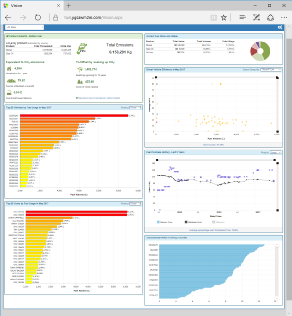
This page shows the status of all the sites, tanks and pumps in the networks, and highlights any unusual activity. Its the first page presented after logging on so that a quick check of your entire network may be made very quickly.

Overview
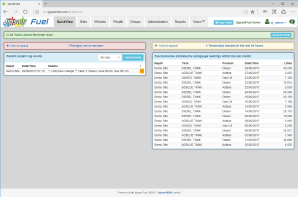
This page shows the status of an individual site, showing up to the second information on fuel stocks and fuelling transactions as they occur - no polling, just live data. The status of pumps and tanks is obvious by the colour coding used
Sites
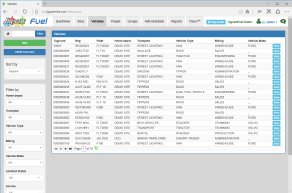
This page lists all the vehicles or other assets which use fuel. Add new vehicles using the New button; edit vehicles or see all the latest fuelling events for that asset by simply clicking on the required entry in the list.
Vehicles
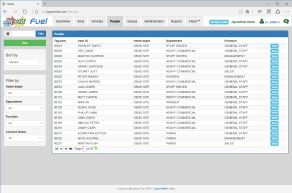
This page lists all the people who are allowed to draw fuel. This would include both drivers and fuellers. Add new people by using the New button; edit details or see all the latest fuelling events for that person by simply clicking on the required entry in the list.
People
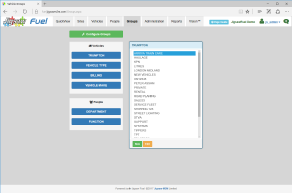
This page allows the setting of groups which may be allocated against vehicles or people. By carefully choosing which groupings are important to your business, the resulting reports will be relevant and informative.
Groups

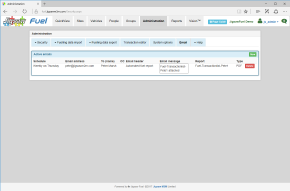
This page gives the user access to the background tasks required by any fuel management system; changing passwords, importing or exporting data, setting up e-mail groups for automatic reporting etc.
Administration
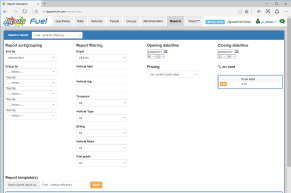
The Jigsaw system has a comprehensive set of report templates which may be configured to your individual requirements.
Once configured, the reports may be saved, then automatically run and e-mailed as required.
Reports may be saved as PDF files or XL Spreadsheets
Reports
The Vision Tab gives access to a set of analysis tools that you can select to suit your business. The individual Tiles give information on the performance of your fleet, your stock holding and quickly highlight unusual fuelling events or vehicles not performing like their peers.
Tiles are being added all the time, but here are a few of the more popular examples :
Stock Holding.
This shows the entire stock holding on a particular site or across all sites along with the total cost price, and the current ullage.
Highest Fuel Usage by Vehicle.
This usually serves to highlight excessive use of the “Yard Key”, but will also show any vehicle taking more than average fuel.
Fuel Purchase Price.
This shows the price paid for fuel at each site on the network and compares it with the national average refinery Gate Price.
Vehicle Efficiency.
This groups similar vehicles into coloured swarms so that any vehicle performing differently than its peers is immediately obvious
Ad Blu Usage.
This directly compares and displays the proportion of AdBlu to diesel for the entire fleet
Vision Tiles :

You cant manage what you cant see - Make sure you have the full picture.
Jigsaw :
Fuelling Your Future
| Eclipse |
| Nova |
| Jigsaw Fuel Web Service |
| Jigsaw Tank Guard |
| Pump Integrated Eclipse |
| Jigsaw EasyFuel |
| Jigsaw TeleTag |
| Fuel Management ID Devices |